iRacingStats originally started as a personal project that I built for myself, because I wanted statistics and information about iRacing that weren’t easily available elsewhere.
In October 2023, I decided to make it publicly available, simply in the spirit of sharing something I found useful with the rest of the iRacing community.
In the years that followed, the project grew considerably, and I continued to maintain the infrastructure needed to keep it running.
I no longer race on iRacing and, over time, I have lost interest in maintaining the project. At the same time, keeping the service running involves significant ongoing costs and an architectural complexity that requires continued maintenance and attention.
For these reasons, I have decided to shut down iRacingStats.net.
I was not looking for donations, sponsorships, someone to cover the operating costs or my iRacing subscription (which I did not renew, so I no longer have access to the iRacing APIs), or someone to take over the project. I also did not open-source it, as the system had grown into a fairly complex architecture over the years and transferring the necessary knowledge would itself have required a considerable amount of work.
iRacingStats was never intended to become a business. It was a personal project that I was happy to share with others for three years, for as long as it made sense for me to do so.
Thanks to everyone who used it over the years. I’m glad that something I originally built for myself ended up being useful to so many other people.
What it became
By the end, iRacingStats was no longer a single box running a website. It was two machines with different jobs, because the live site and the heavy statistics could not share the same database without getting in each other’s way.
Primary host
The public site and a Go backend. MariaDB held the live data. Redis cached week results so ordinary page views did not have to read the full database every time.
nightly backupaggregates back
Daily stats host
Each day this machine restored a backup of the main database, computed aggregates that were too expensive for the primary host (track participation, iRating distributions, and similar work), then copied only those results back.
That split existed for a practical reason: the daily statistics would have loaded the main host enough to hurt the site. The restore-compute-copy-back cycle was slower and more complex, but it kept the public service usable.
The daily stats host was also running out of disk. Keeping that restore cycle going would have required expanding the daily stats host’s storage. Hosting costs had already risen considerably as RAM and other hardware became much more expensive.
~7.5 millionofficial race splits stored, from December 2020 to September 2026
~235 milliondriver-result rows stored across race and other sessions
~5,000race splits per day over the last 14 complete days, with 132–177 thousand driver-result rows across all sessions
~131 GBon disk for the database on the daily stats host
Where visits came from
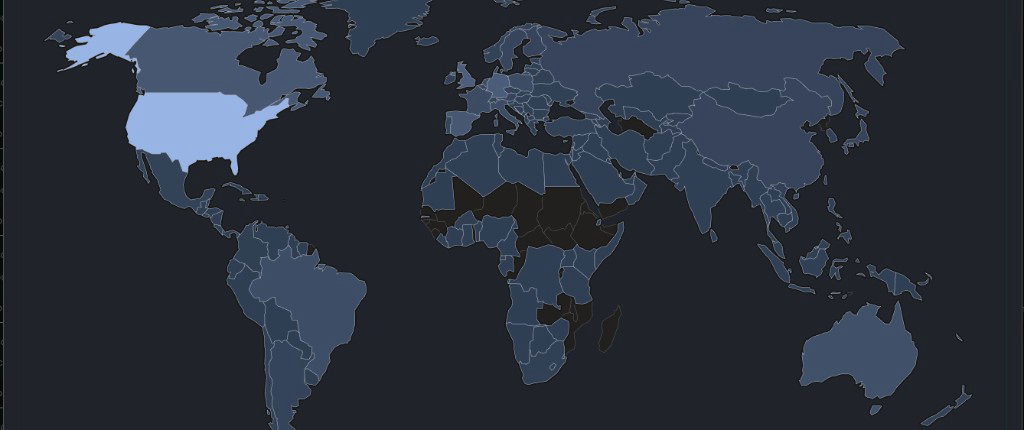
From October 2023 through September 6, 2026, the public pages recorded about 543,000 visits. The United States was far ahead. The rest of the map is what you would expect from iRacing: Europe, Canada, Australia, Brazil, and a long tail of other countries.
Devices
Share of all recorded visits
Desktop
64.7%
Phone
34.5%
Tablet
0.8%
Operating systems
Share of all recorded visits
Windows
55.5%
iOS / iPadOS
21.7%
Android
13.5%
macOS
7.4%
Linux
1.7%
Top countries
United States154,25328.4%
United Kingdom37,5566.9%
Germany37,1036.8%
Spain29,8805.5%
Canada29,2775.4%
Australia21,0053.9%
Brazil17,7683.3%
Netherlands15,6832.9%
Poland15,4332.8%
Italy15,3992.8%
Show 30 more countries
France14,6762.7%
Sweden8,3441.5%
Belgium7,5661.4%
Austria6,9871.3%
China6,8481.3%
Japan6,8291.3%
Portugal6,8141.3%
Finland6,6621.2%
Russia6,3641.2%
Switzerland6,2071.1%
Argentina5,3841.0%
Hong Kong4,9890.9%
Norway4,6430.9%
Mexico4,4540.8%
Czechia3,9900.7%
Turkey3,6640.7%
Hungary3,2960.6%
New Zealand2,9330.5%
Ukraine2,7900.5%
Denmark2,7120.5%
Slovakia2,5810.5%
Chile2,5450.5%
South Africa2,4050.4%
Belarus2,3770.4%
Taiwan2,3620.4%
Singapore2,2670.4%
Romania2,0910.4%
Ireland2,0500.4%
South Korea2,0140.4%
Latvia1,6290.3%
Seeing thousands of drivers using stats I originally made just for myself was genuinely one of the coolest things that came out of this project.